The same in other media
The series of graphs that reveal the true terrible impact of COVID-19 across Greater Manchester
Reading now: 848
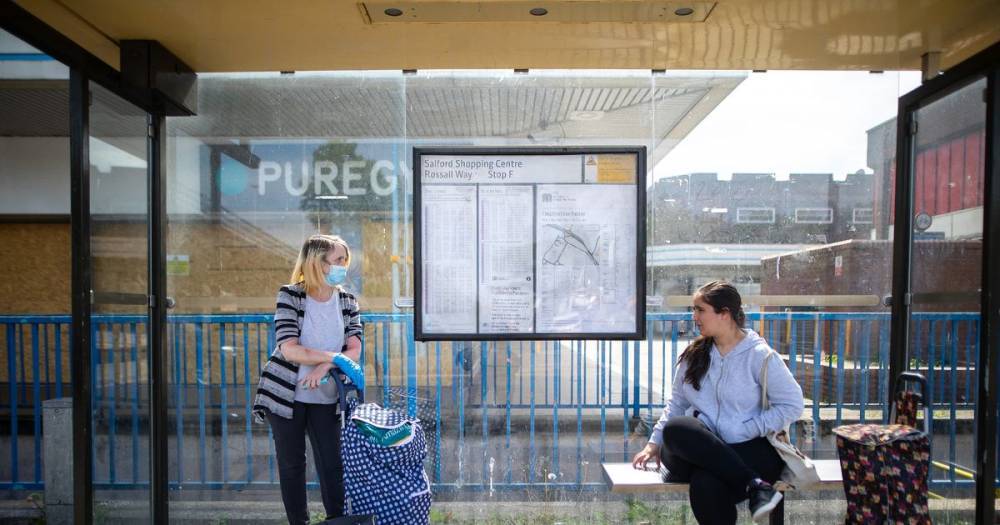
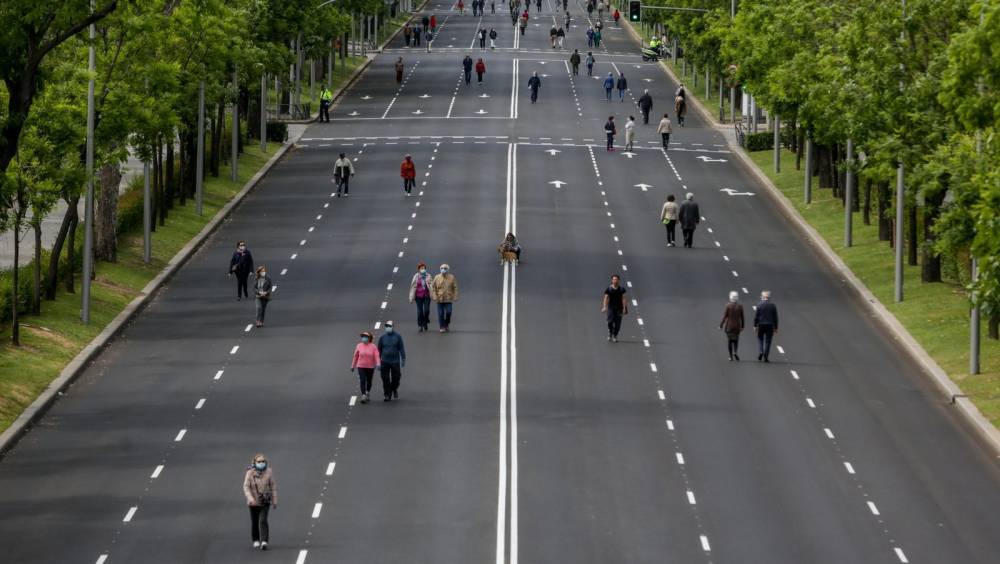
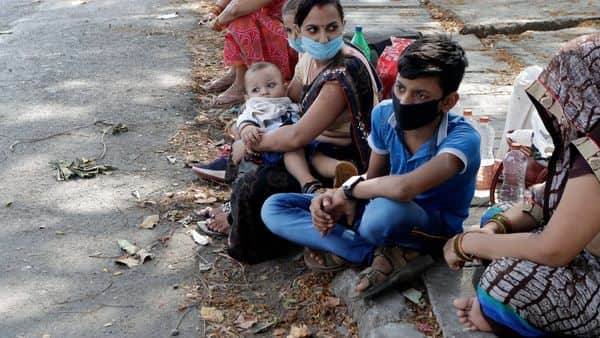
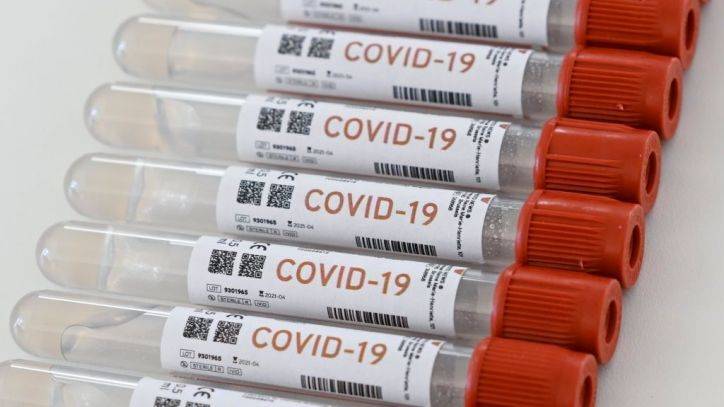
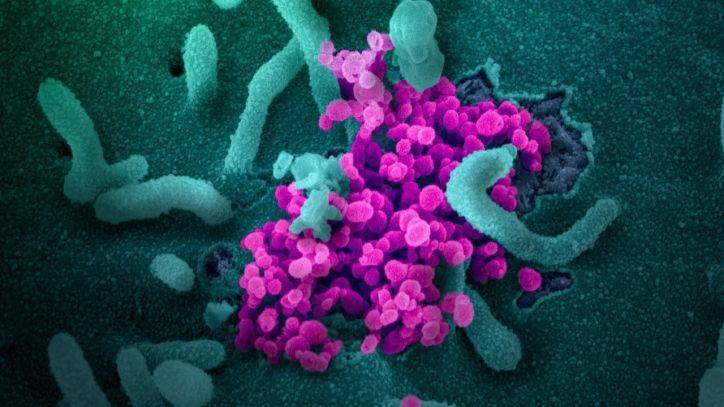
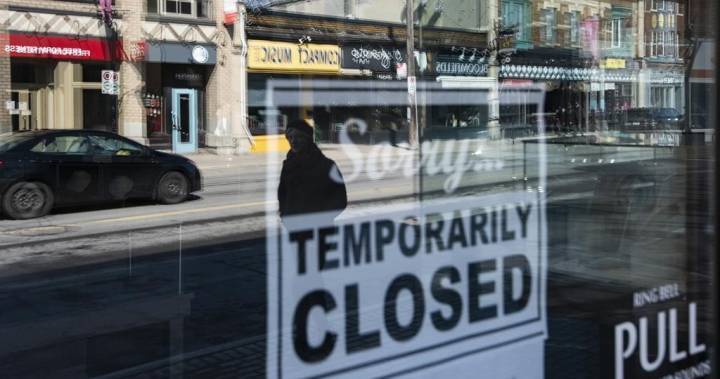
These charts reveal the true impact of Covid-19 across Greater Manchester. The models - prepared by Manchester -based data firm Urbix using data from the Office for National Statistics - show that the number of coronavirus deaths has risen significantly from those reported.
It suggests that the reported number of deaths from the virus does not fully account for the increase in death rate. Urbix looked at recorded deaths from 2015 up to the end of April 2020.
Analysts then plotted the average death toll per month for the years 2015 - 19. This is represented on each chart by a black line.
For 2020 they plotted all deaths, shown in green, and only Covid-19 registered deaths, shown in red. Greater Manchester has an annual average death rate of
Read more on manchestereveningnews.co.uk
The website covid-19.rehab is an aggregator of news from open sources. The source is indicated at the beginning and at the end of the announcement. You can send a complaint on the news if you find it unreliable.


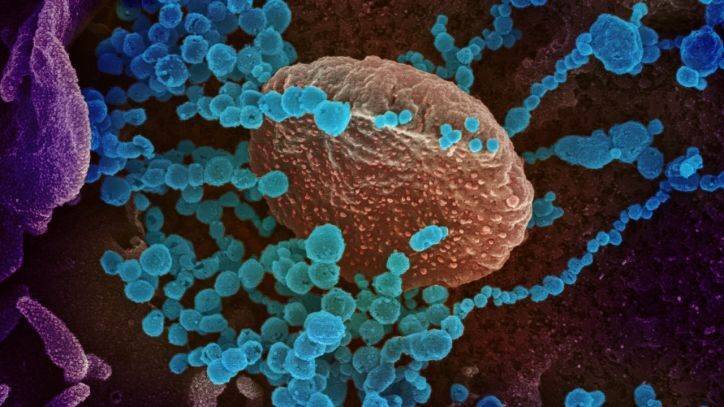


COVID-19

United States
|
Cases: 46 252 513
Deaths: 750 423
Recovered: 0
|

India
|
Cases: 34 321 025
Deaths: 459 652
Recovered: 0
|

Brazil
|
Cases: 21 835 785
Deaths: 608 235
Recovered: 0
|

United Kingdom
|
Cases: 9 215 683
Deaths: 141 607
Recovered: 0
|

Russia
|
Cases: 8 494 589
Deaths: 237 619
Recovered: 0
|